Logging and monitoring
Central logging and monitoring
We utilize Logz.io as our monitoring provider. It combines the best-of-breed open-source monitoring tools with a fully managed cloud platform. All logs, metrics and traces associated with your projects will be accessible on this platform.
Access
In logz.io data is separated in different organizational units, so called sub accounts of the Netilion managed main account. Access to logs, metrics and traces is managed over these accounts. We will provide you with such a sub account if you don’t have one yet.
Logs
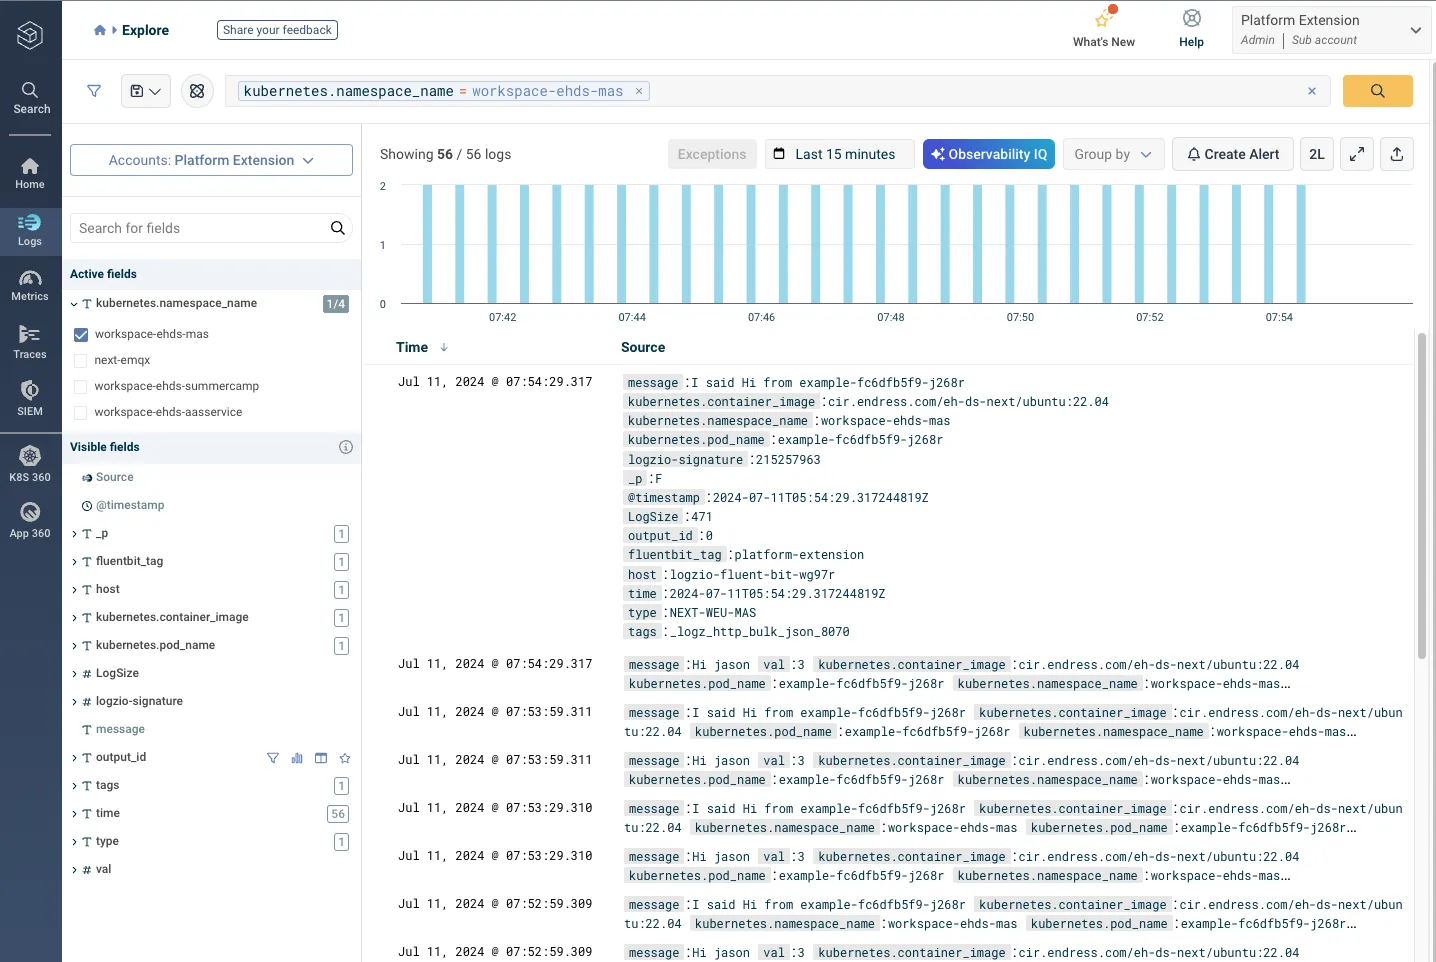
Logz.io’s log management is built around OpenSearch and OpenSearch Dashboards, which are the open-source versions of Elasticsearch and Kibana. The NEXT-Platform takes care for collecting the logs in the Kubernetes cluster and writing them to logz.io. All logs that your applications write to standard output, will be available there automatically.
The logs are augmented with kubernetes information like the namespace or the name of the pod (container). If you have multiple applications deployed you can filter on these information. The information from which environment (weu-dev, weu-qas, weu-prd) the log entry is coming from, is stored in the type field.
The log message will be in the message field. If you use json format for your logging, the json will be parsed and can be filtered on.
Metrics
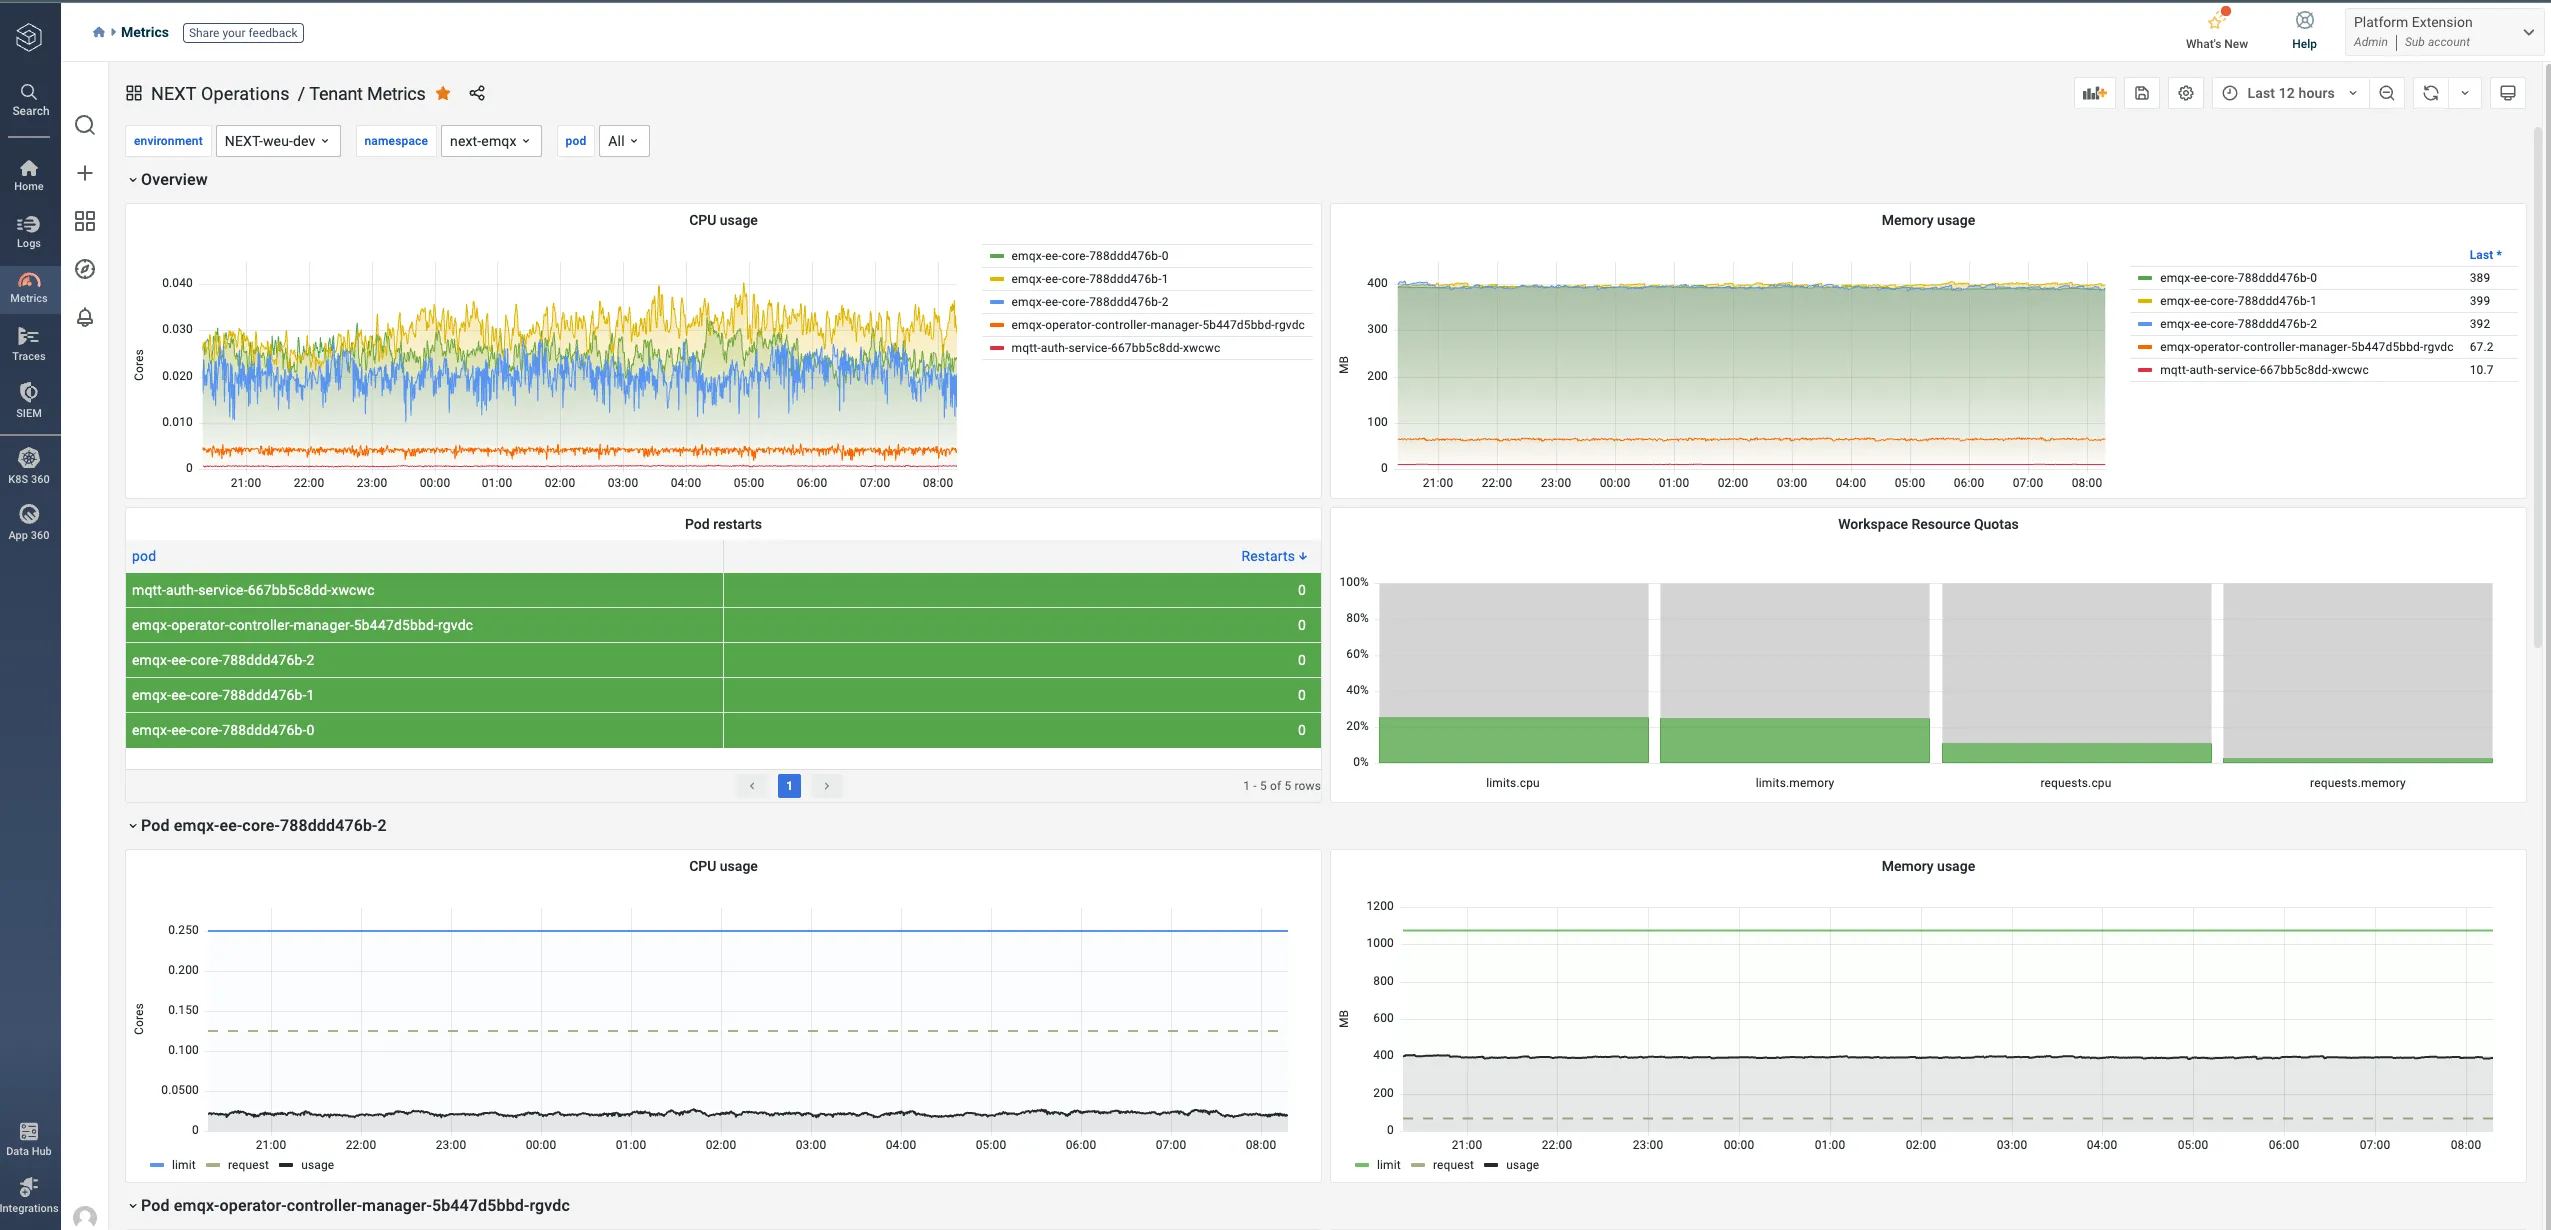
Logz.io uses Prometheus and Grafana for metrics storage and dashboards. We automatically collect resource consumption (cpu, memory), quota usage and kafka metrics of all applications and store them in a common account, to which you will be granted user access.
For these metrics we provide a Grafana Dashboard, where you can monitor your application. You can also create your own dashboards, or alter the provided dashboard to your needs.
Expose your own metrics
It is possible to integrate additional metrics of your applications in Logz.io. Your application has to expose a metrics endpoint in the cluster where the metrics are returned. There are SDKs for different programming languages that make this easier. This endpoint will return the current values of the metrics. The metric collector will query this endpoint on a fixed interval and write the metrics to logz.io. To enable this metric collection (also called scraping) you have to set following annotations on your pod or service and configure the path and port where your application exposes the metrics:
metadata: annotations: prometheus.io/scrape: 'true' prometheus.io/path: '/data/metrics' prometheus.io/port: '80'Distributed Tracing
For tracing Logz.io integrates the Jaeger framework which is compatible with the OpenTelemetry Tracing format. To enable tenant separated access to traces we will setup a separate tracing account (upon request). In the cluster we operate an OpenTelemetry Collector that is able to receive your traces and routes them to your account. Please contact our team for further information.